|
I have been working for a national store chain as a data analyst. Management is interested in the amount of inventory being kept in storage at regional sites. My supervisor has asked me to perform an analysis on inventory and sales data to make recommendations for changes to inventory management practices. I have been provided with three datasets containing information about inventory, products, and sales.
Download data: I using both spreadsheets and SQL. I use spreadsheets to clean the data before importing it into SQL for analysis. Inspect the data in spreadsheet Applying filters in spreadsheets is a good way to identify any data that needs to be cleaned. Check on the ProductID column, I found that there is a NA value in this column, despite the fact that this column should only have numeric values. In this case, I’ve checked in with the dataset owner, who said I can delete this row because it was input by mistake and does not belong in this dataset. From spreadsheets to BigQuery Now that I have checkedthe your data in a tool that lets me observe and interact with the data directly, it’s time to transition to using SQL. With SQL, I can only observe the results of my query, which requires a different mindset than spreadsheets — but SQL is very powerful when I'm working with databases and larger datasets! Next, I need to inspect the data to determine how much of it will be useful for the final analysis. 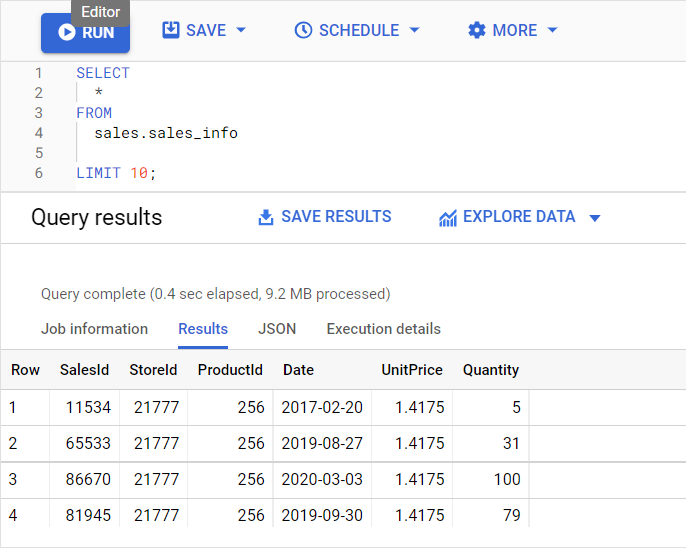
Next, inspect the data to find out how many years of sales data it includes. I can use the MIN and MAX functions to get the oldest and newest dates.
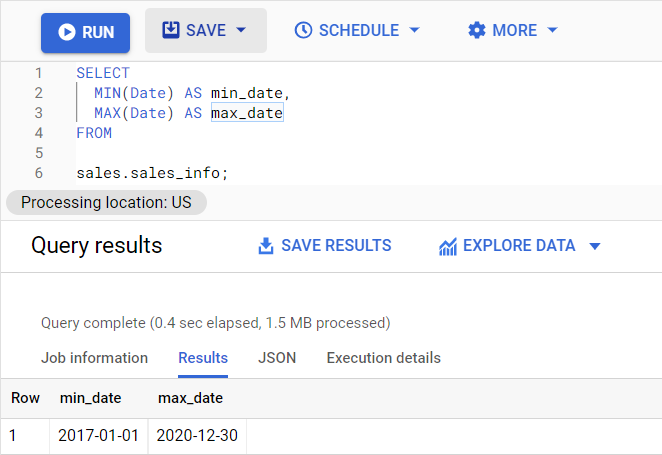
Now I know what years this data covers. In this case, I want to group the data by month because management wants to see year-over-year changes to inventory by month.
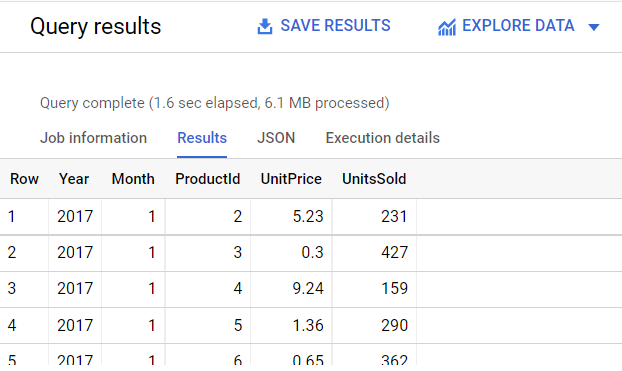
Run the following query, which will return the total quantity sold for each ProductId grouped by the month and year it was sold.
Export results to spreadsheet
The subset of data I queried is fewer than 50,000 rows. This means it can be easily exported to a spreadsheet, if my stakeholder requests the data in this form. Or, I can use this exported spreadsheet for visualization. Download result.
TAGS :
Comments are closed.
|

ISRIL CANIAGONEED HELP?
Please feel free to reach out to me if you have any questions
Categories
All
|
 RSS Feed
© 2017 Isril Caniago. All rights reserved
