|
I’ve been asked to analyze subway ridership data to help improve the quality of the city’s public transportation. I use basic calculations in SQL to help you make sense of this data.
I use data that describes the average weekly subway ridership in New York City from 2013-2018. The columns include: subway stations, subway routes, weekly ridership for each year (2013-2018), the change in ridership from 2017 to 2018 (both in raw numbers and percent), and the ridership rank of each station in 2018. Each row corresponds to a different station in the subway system. Use a calculation with a single operator 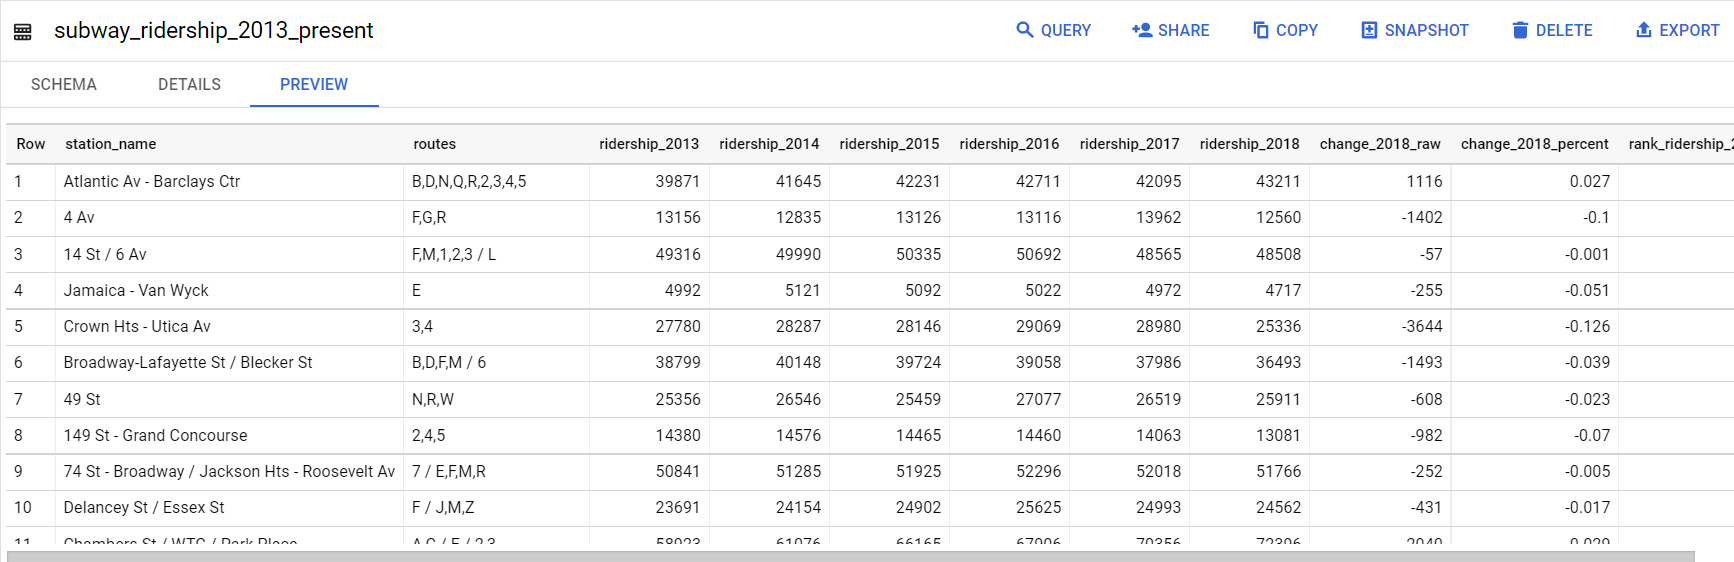
The change_2018_raw column describes the change in weekly ridership from 2017 to 2018 in raw numbers. I want to find data on the change in weekly ridership from 2013 to 2014. I can use SQL to subtract the number of riders in 2013 from the number of riders in 2014.
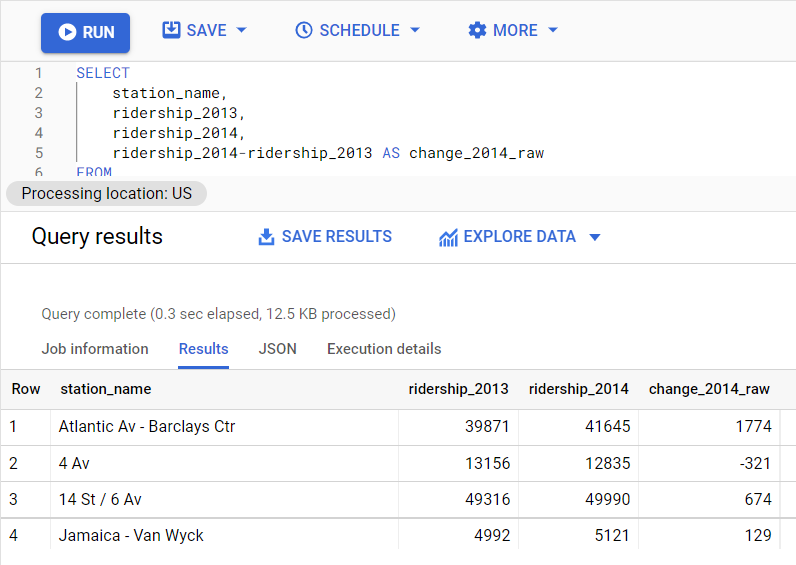
The results show the change in ridership from 2013 to 2014. For example, the Atlantic Av - Barclays Ctr station gained an average of 1,774 riders per week. The 4 Av station lost 321 riders.
By including a basic calculation in my query, I can get an idea of the change in ridership for each subway station in any given year. Basic calculations help me quickly gain important knowledge about the data. Use a calculation with multiple operators The original dataset describes average weekly ridership for each individual year. I want to find average weekly ridership for a longer period of time, such as the multi-year period from 2013-2016. To do this, I can combine multiple arithmetic operations in a query. The average of a set of numbers is the sum of the numbers divided by the total number of values in the set. There are four values in your new set (ridership data for 2013, 2014, 2015, 2016). I can use SQL to sum the numbers for each year and divide that sum by 4. 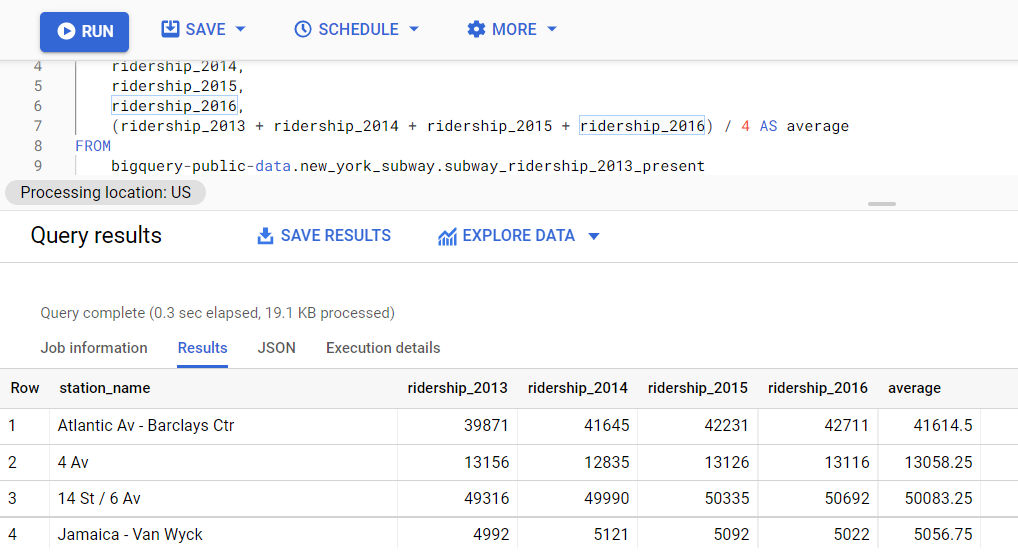
The results clearly show the trend in ridership at each station from 2013 to 2016. For example, weekly ridership at the Atlantic Av - Barclays Ctr station increased every year since 2013. Further, for the years 2014, 2015, and 2016, weekly ridership at Atlantic Av - Barclays Ctr exceeded the overall average for the period 2013-2016 (listed in the average column).
This kind of data is useful for managing public transportation. It can help me determine which stations or routes to expand due to increased ridership. Using basic calculations in my query allows me to quickly discover significant patterns in the data.
TAGS :
Comments are closed.
|

ISRIL CANIAGONEED HELP?
Please feel free to reach out to me if you have any questions
Categories
All
|
 RSS Feed
© 2017 Isril Caniago. All rights reserved
