Introduction
About the company
Cyclistic is a bike-share program that features more than 5,800 bicycles and 600 docking stations. Cyclistic sets itself apart by also offering reclining bikes, hand tricycles, and cargo bikes, making bike-share more inclusive to people with disabilities and riders who can’t use a standard two-wheeled bike. The majority of riders opt for traditional bikes; about 8% of riders use the assistive options. Cyclistic users are more likely to ride for leisure, but about 30% use them to commute to work each day.
In 2016, Cyclistic launched a successful bike-share offering. Since then, the program has grown to a fleet of 5,824 bicycles that are geotracked and locked into a network of 692 stations across Chicago. The bikes can be unlocked from one station and returned to any other station in the system anytime. Until now, Cyclistic’s marketing strategy relied on building general awareness and appealing to broad consumer segments. One approach that helped make these things possible was the flexibility of its pricing plans: single-ride passes, full-day passes, and annual memberships. Customers who purchase single-ride or full-day passes are referred to as casual riders. Customers who purchase annual memberships are Cyclistic members. Cyclistic’s finance analysts have concluded that annual members are much more profitable than casual riders. Although the pricing flexibility helps Cyclistic attract more customers, the director of marketing, believes that maximizing the number of annual members will be key to future growth. Rather than creating a marketing campaign that targets all-new customers, She believes there is a very good chance to convert casual riders into members. She notes that casual riders are already aware of the Cyclistic program and have chosen Cyclistic for their mobility needs. Processes for data analysis phases:
1. ASK questions and define the problem (Business Challenge/Objective/Question)
A. Identify the business task: Design marketing strategies aimed at converting casual riders into annual members. To do that, however, the marketing analyst team needs to better understand;
B. Consider key stakeholders:
2. PREPARE data by collecting and storing the information (Data generation, collection, storage, and data management) A. Download data and store it appropriately: I download The Cyclistic’s historical trip data and create a folder on my secured drive to house the files and use appropriate file-naming conventions and then create subfolders for the .csv file so that I have a copy of the original data. B. Identify how it’s organized: The data were organized as separate files by month and year. The data were saved as .csv files within .zip folders. The data included the following attributes:
C. Sort and filter the data: I'm going to focus on the 2021 period as it's the more relevant period to the business task.
D. Data integrity:
E. Data bias: The data can represent all the population and be used for trend identification for this project. The data is truly representative of the population as a whole. F. Data credibility: Good data must be ROCC (Reliable, Original, Comprehensive, Current, and Cited). Here ROCCC process is used to check data credibility.
G. Data limitation:
H. Data ethics and privacy:
3. PROCESS data by cleaning and checking the information (Data cleaning/data integrity) A. Choose the tools: The combined size of all the 12 datasets is close to 1 GB. Data cleaning in spreadsheet will be time-consuming and slow compared to SQL or R. I am choosing R simply because I could do both data wrangling and analysis even visualizations in the same platform. B. Transform the data: Involves the processes such as data migration, data warehousing, data integration, and data wrangling.
1. load packages
In the first step, I need to load some R packages.
note: to get my R explanation codes, click View Notebook below.
2. Import Data
Import customer's historical trip details over 12 months (January 2021 - December 2021)
3. Inspect Data Structures
Since I am working with large data set, sometimes, I need to get an overview of the specific structure and look for incongruencies.
Conclusion:
All data have the same number of column and column names.
4. Compare Data Type
Inspect the data type and look for incongruencies.
Conclusion:
The data type in all datasets is consistent.
5. Combine multiple Datasets
After inspecting data structure and data type and finding no value mismatch, I can proceed to the next step which is for data merging. So, I can easily analyze it all in one go.
6. RENAME COLUMNS
I changed the names of some columns for better readability.
7. Add new columns
I added a column as follows:
Note: I might be able to find out the ride distance by calculating the distance between the two points (Lat, Long). But how about a trip that starts and ends at the same station? It is possible for the user to go around the city and go back to the start station. It makes the ride distance value is zero. Similarly, if I add a ride speed field it will produce the same value as ride distance since the speed formula = distance/time elapsed. So I didn't create Ride Distance and Ride Speed fields to avoid creating biased data.
C. Check the data for errors: Involves the processes such as data validation
8. Identifying dirty data
I inspected the data to find out if there were any errors in the data.
A. Find out duplicate values in trip_id column.
Conclusion:
B. Find out the number of mean, min, max, empty, missing, and unique values in each variable.
Conclusion:
C. Find out the strange station name.
Conclusion:
D. Find out the outliers.
Conclusion:
D. Clean the data: Involves the processes such as data cleansing
9. remove dirty data
After identifying errors in the data, now I need to remove it all to get the data clean.
10. remove unused columns
I removed some columns as follows:
11. export data
Now the data was clean, so it's time to export the data set a CSV file for further analysis.
E. Document the cleaning process: I save my R documentation of any data cleaning or manipulation and code explanation on my Kagle.
4. ANALYZE data to find patterns, relationships, and trends. (Data exploration, visualization, and analysis) A. Aggregate the data and perform calculations to identify trends and relationships: I. Conduct descriptive analysis on the ride length (all figures in minutes).
1. The summary statistics on the ride length
2. The Distribution of ride length
Analyzing the result:
3. The average ride length by hour of the day
Analyzing the result:
Analyzing the result:
Analyzing the result:
Analyzing the result:
4. The average ride length by days of the week
Analyzing the result:
5. The average ride length by day
Analyzing the result:
6. The average ride length by month
Analyzing the result:
II. Conduct descriptive analysis on the number of rides.
1. The number of rides
Analyzing the result:
2. The number of rides by hour of the day
Analyzing the result:
Analyzing the result:
Analyzing the result:
Analyzing the result:
3. The number of rides by days of the week
Analyzing the result:
4. The number of rides by day
Analyzing the result:
Analyzing the result:
5. The number of rides by month
Analyzing the result:
III. Conduct descriptive analysis on the bike type.
1. The number of bike type usage
Analyzing the result:
2. The number of bike type usage by user type
Analyzing the result:
IV. Conduct descriptive analysis on the station.
1. The number of stations
2. The top 10 most visited stations
3. tHE TOP 10 MOST VISITED STATIONS by user type
4. geographical distribution
5. SHARE data with the audience. (Communicating and interpreting results)
A. Create effective data visualizations: I am choosing Tableau as the platform lends itself to “drag and drop” functionality and allows one to create simple yet clear visuals and to join data from various sources. 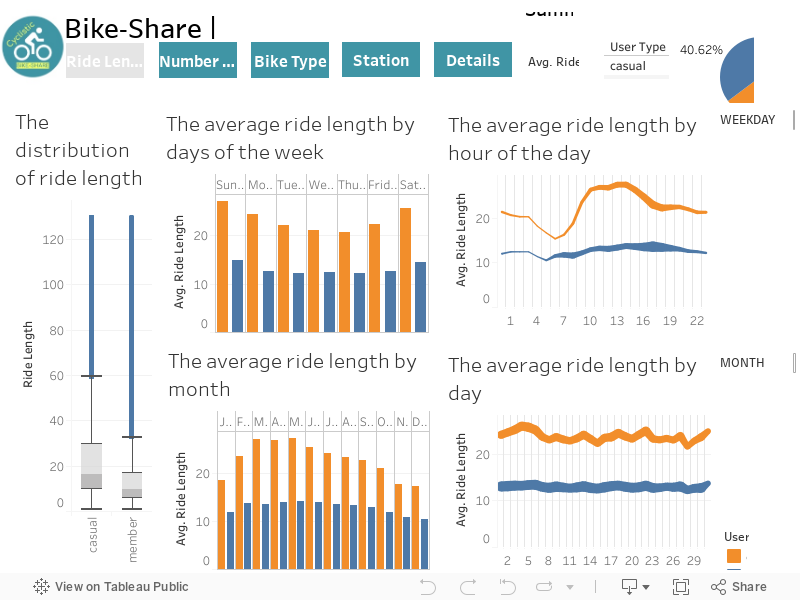
Click full screen for a better view or click here to see the original viz.
B. Present the findings: I am choosing Google Slides for the presentation tool.
6. ACT on the data and use the analysis results. (Putting the insight to work to solve the problem)
A. Final conclusion based on the analysis: 1. Member
2. Casual
B. Recommendations: 1. Best promotion time, bike type, and location for Casual The best odds to launch the new marketing campaign are between 15:00 to 19:00, Weekends and Holidays, June to September. The promotion should be focused on Classic Bike. A targeted strategy at stations along the coast will reach the maximum number of Casual riders. 2. Improved the benefits for Member Since Casual has longer ride lengths than Member, limitation on the ride length should be extended to one of Member benefits. Most Casuals’ purpose uses Cyclistics’ bikes for leisure, so marketing campaign must be related to health such as the health statistics on the mobile app for annual subscription. 3. Launch the mobile app The rider can create a profile that contains data such as riders’ IDs, age, gender, occupation, and geographical location. It will gain insight into what marketing tactics to use. While the purchase history will provide insight into how much potential Casual can afford to purchase an annual subscription. C. Further explorations: Some level of identifiable data is needed to perform further analysis at a personal level. This data might include:
Acknowledgement
Thanks to Google Data Analytics Professional Certificate provided by Coursera! By working through all the courses included in the Certificate and utilizing the data analysis roadmap provided by the Capstone Project, I get key skillset and resources to accomplish this case study independently.
Thank you all for reading!
TAGS :
Comments are closed.
|

ISRIL CANIAGONEED HELP?
Please feel free to reach out to me if you have any questions
Categories
All
|

 RSS Feed
© 2017 Isril Caniago. All rights reserved
