|
The Background
I used to work for a hotel booking company. I have cleaned and manipulated this data, and gotten some initial insights I would like to share. Now, I am going to create some simple data visualizations with the `ggplot2` package. I will use basic `ggplot2` syntax and troubleshoot some common errors I might encounter. Step 1: Import data You can download this dataset. In the code below, I use the `read_csv()` function to import data from a .csv in the project folder called "hotel_bookings.csv" and save it as a data frame called `hotel_bookings`:
Step 2: Look at a sample of the data
Use the `head()` function to preview the data:
Use `colnames()` to get the names of all the columns in the data set. Run the code below to find out the column names in this data set:
Step 3: Install and load the 'ggplot2' package
Run the code below to install and load `ggplot2`.
Step 4: Begin creating a plot
A stakeholder tells me, "I want to target people who book early, and I have a hypothesis that people with children have to book in advance." When I start to explore the data, it doesn't show what I would expect. That is why I decide to create a visualization to see how true that statement is-- or isn't. I use `ggplot2` to do this. Try running the code below: 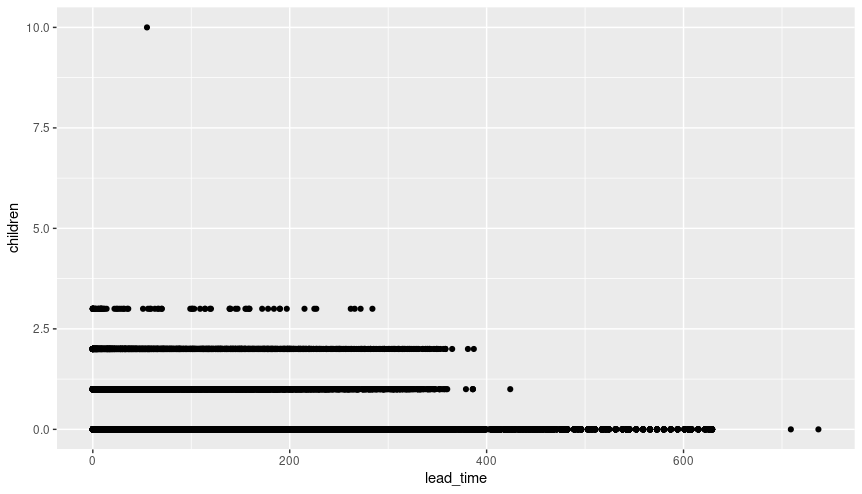
The geom_point() function uses points to create a scatterplot. Scatterplots are useful for showing the relationship between two numeric variables. In this case, the code maps the variable 'lead_time' to the x-axis and the variable 'children' to the y-axis.
On the x-axis, the plot shows how far in advance a booking is made, with the bookings furthest to the right happening the most in advance. On the y-axis it shows how many children there are in a party. The plot reveals that the stakeholder's hypothesis is incorrect. I report back to the stakeholder that many of the advanced bookings are being made by people with 0 children. Next, the stakeholder says that she wants to increase weekend bookings, an important source of revenue for the hotel. The stakeholder wants to know what group of guests book the most weekend nights in order to target that group in a new marketing campaign. She suggests that guests without children book the most weekend nights. Is this true? Try mapping 'stays_in_weekend_nights' on the x-axis and 'children' on the y-axis by filling out the remainder of the code below. 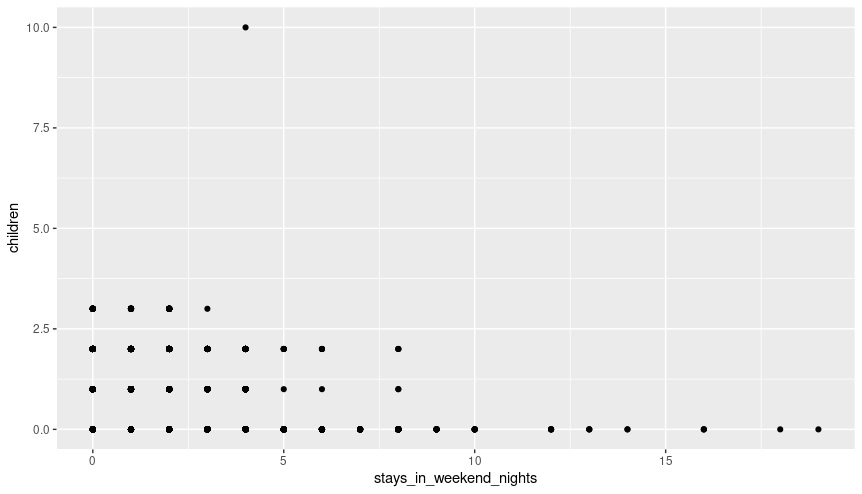
TAGS :
Comments are closed.
|

ISRIL CANIAGONEED HELP?
Please feel free to reach out to me if you have any questions
Categories
All
|
 RSS Feed
© 2017 Isril Caniago. All rights reserved
